In Harris County, a Lower Market Value Can Still Come With a Higher Appraisal
Original research by Harris Value · Published September 4, 2026 · HCAD snapshot: August 30, 2026
HCAD can lower its estimate of what your home is worth on the market while your appraised value goes up. We identified that split for 66,758 Harris County single-family homes when comparing 2025 and 2026 values in its August 30 data.
That can make an appraisal notice difficult to read: a lower number in one column does not guarantee a lower number in the other. We compared more than 1.1 million property records to see how often this happened, where it was concentrated, and what to check on your own record.
What does your appraisal say?
Enter your Harris County address to see your market and appraised values, then explore your full property record.
Free lookup. No email or account required.
Have your latest notice handy? You can also check the official HCAD record.
5.8%
of homes we could compare
66,758 of 1,143,500 homes
12.0%
of homes with market declines
66,758 of 555,039 homes
50,193
had both changes of at least 1%
Market value fell ≥1%; appraised value rose ≥1%
Market value, appraised value, and your tax bill are different numbers. This report measures HCAD value changes. It does not measure tax-bill increases, protest results, or whether an individual appraisal is correct.
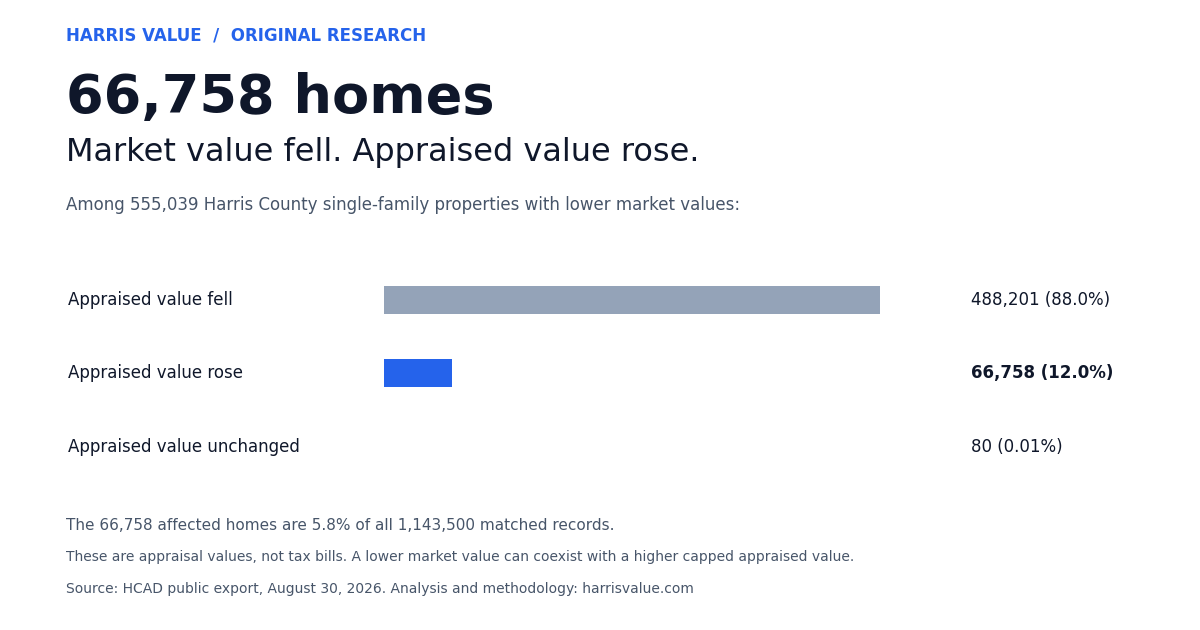
When market values fell
What happened to appraised values for 555,039 homes?
Appraised value fell
488,201 homes · 88.0%
Appraised value rose
66,758 homes · 12.0%
Appraised value unchanged
80 homes · 0.01%
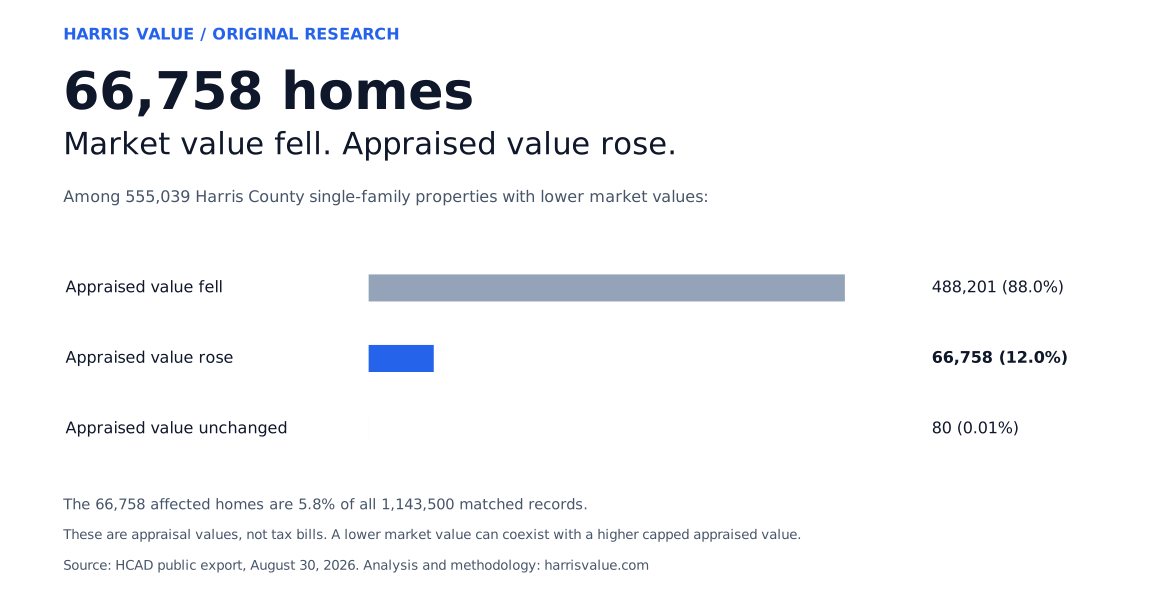
Two columns. Two different directions.
Among the affected homes, the median market-value change was −3.4% and the median appraised-value change was +8.5%. These are separate medians of each home’s percentage change, not a change in the county’s median home value.
The headline includes any decline and increase of at least one dollar. Requiring both movements to be at least 1% leaves 50,193 homes, or 75.2% of the headline group.
For most homes with falling market values, appraised values fell too: 88.0% followed that pattern. The surprise is how concentrated the opposite result was in particular places.
The 66,758 figure describes the single-family homes we could verify in this snapshot. It does not count other property types, homes with incomplete values, or records updated afterward. Another 39,276 single-family homes had market values stay flat while appraised values rose; that is a separate pattern from the declines measured here.
Where the countywide story becomes local
In HCAD’s Central Park appraisal area, 836 homes had market values fall while appraised values rose—nearly half of the 1,814 records we could compare. The share topped half in Glen Oaks and the combined Elmwood/Pembrook Place area.
Beaumont Place sections 1–4 was a striking outlier: 388 of 427 homes, or 90.9%. Even requiring both changes to be at least 1% leaves 387 homes. Its result shows how far one local area can differ from the county’s 5.8% overall rate.
| HCAD appraisal area | Homes | Share |
|---|---|---|
| CENTRAL PARK | 836 of 1,814 | 46.1% |
| ELMWOOD/PEMBROOK PLACE | 652 of 1,278 | 51.0% |
| GLEN OAKS | 446 of 874 | 51.0% |
| LIBERTY HEIGHTS E & HARBOR HOMESITE | 704 of 1,590 | 44.3% |
| BEAUMONT PLACE 1-4 | 388 of 427 | 90.9% |
Selected examples, not a ranking of entire neighborhoods. Shares use usable single-family records within each HCAD appraisal area; some areas combine subdivisions. Search below for your ZIP or area.
Find your ZIP code or appraisal area
Search 137 ZIP codes or 2,917 named HCAD appraisal areas. Each has at least 100 usable single-family records. ZIP results cover only properties in HCAD’s dataset. HCAD areas may combine several subdivisions.
137 matching ZIP codes. Showing 10.
| ZIP code | Usable homes | Market down, appraised up | Share of usable homes |
|---|---|---|---|
| 77016 | 10,334 | 2,064 | 20.0% |
| 77433 | 41,814 | 2,038 | 4.9% |
| 77088 | 14,370 | 1,833 | 12.8% |
| 77033 | 8,767 | 1,639 | 18.7% |
| 77020 | 7,020 | 1,462 | 20.8% |
| 77076 | 6,317 | 1,304 | 20.6% |
| 77375 | 19,953 | 1,294 | 6.5% |
| 77049 | 9,361 | 1,249 | 13.3% |
| 77021 | 7,482 | 1,207 | 16.1% |
| 77086 | 5,656 | 1,205 | 21.3% |
A high share describes this pattern; it does not establish appraisal error or higher tax bills. Download the complete ZIP table (CSV).
How market value can fall while appraised value rises
A home’s capped appraised value can start below its market value. Under the residence-homestead cap described by HCAD, the next appraised value is limited to the lower of the current market value or the prior appraised value plus 10% and qualifying new improvements. The two values can move toward each other even when market value falls. Read HCAD’s cap explanation.
An illustrative example
Hypothetical amounts, assuming the homestead cap applies in both years and there are no qualifying new improvements.
| HCAD value | Prior year | Current year |
|---|---|---|
| Market value | $500,000 | $450,000 down 10% |
| Appraised value | $300,000 | $330,000 up 10% |
The current appraised value is the lower of $450,000 and $330,000. This illustrates a possible mechanism; the aggregate data does not establish the cause for each of the 66,758 properties.
A lower market value also does not automatically change the capped appraised value. HCAD explains this distinction in its capped-value FAQ. Exemptions, taxing-unit rates, and other applicable limits affect the eventual bill.
Now take a look at your own appraisal
Compare the market and appraised columns for both years, then check the recorded exemptions and any improvements. Verify the latest values with HCAD: this report is a dated snapshot, and individual records can change after it.
Sources, methodology, and limitations
- Source and snapshot
- HCAD public property downloads, 2026 Real_acct_owner.zip, updated August 30, 2026. We used real_acct.txt and real_neighborhood_code.txt. Analysis generated 2026-09-05 UTC. The source’s value-status labels are “Noticed” or “Value Unchanged, Notice Not Required” for the usable cohort; we do not describe this as a final certified roll.
- Property population and exclusions
- One record per valid account with year 2026 and state class A1 (single-family residential). All four total market/appraised values must be positive whole dollars, and appraised value cannot exceed market value in either year. Of 1,628,241 source rows, 470,500 were another year or class and 1 was malformed. Within the 1,157,740 target records, 14,240 failed value completeness. There were no duplicate target accounts, invalid target account numbers, or appraised-above-market exclusions. New or changed properties lacking a comparable prior value are excluded.
- Calculations and denominators
- “Market down, appraised up” means current total market value is strictly below prior total market value and current total appraised value is strictly above prior total appraised value. Percentage change uses the prior-year value. The 5.8% headline rate and local-table shares use all usable records. The 12.0% rate uses only records with a market decline. The 1% sensitivity check applies the threshold to both changes before rounding.
- Local coverage
- ZIPs use the situs ZIP field, accepting five digits or an explicit ZIP+4. 190 usable records lacked a valid ZIP. 8 ZIP groups with 172 records and 2,863 appraisal areas with 119,146 records were below the 100-record publication threshold. These records remain in county totals. Area names and codes come from HCAD; they are not a map of municipal or civic-neighborhood boundaries.
- What this study cannot establish
- This is a descriptive snapshot, not a causal study or a measure of tax savings. Changes in improvements, ownership, exemptions, corrections, or protests may affect individual values. We did not verify homestead eligibility for each record or attribute every divergence to the cap. The source’s prior-year columns and current values may reflect different stages of appraisal or review. We did not calculate tax bills or estimate protest success.
- Responsibility and corrections
- Harris Value performed the analysis and publishes the property-comparison tool linked from this site. Send reproducible questions or corrections to [email protected], including the source snapshot and the table or calculation in question.
Source archive SHA-256: 80397483d1e427d75761f62c263ba5905b8342a92d72321ff323a9609ff0c5e9